Languages
RAPELD in marine ecosystems.
RAPELD is an environmental-monitoring system initially developed for monitoring areas subject to logging in tropical environments, but which has been implemented in various ecosystems and for different land uses, such as forests and Amazonian savannas, the Pantanal, eucalyptus forests in Australia, and agricultural areas (Costa & Magnusson 2010 , Magnusson et al. 2013 ). It is being adopted by various bodies responsible for the monitoring and evaluation of environmental impacts, including the Brazilian agencies ICMBIO, IBAMA and the SFB and, today, is probably the monitoring system with the highest global rate of increase in usage, in terms of km2 monitored. ICMBIO is assessing it's implementation in the Tupinambás Ecological Station (Marli Penteado, pers. com.), and a meeting with several stakeholders approved planning[1]. However, RAPELD has not yet been effectively implemented the marine environment. In this proposal, we outline the system's advantages for monitoring the Brazilian marine environment. More detailed information about RAPELD can be found in the references Costa and Magnusson (2010), Magnusson et al (2013) and on the PPBio website[2]. Here we only answer the questions often raised in relation to marine ecosystem monitoring.
Why a spatially standardized system?
The management of large-scale ecosystems requires that information can be converted into layers for use in geographical information systems (GIS). For simple variables such as pH or plankton biomass, simple extrapolation may be possible, but factors that are inherently multivariate such as those that describe biodiversity cannot be extrapolated by simple multiplication and division. For concepts such as complementary species and beta diversity there are complex relationships with space, and these spatial relationships vary geographically and temporally, which means that they can not be described or defined a priori using mathematical models. It is these concepts that underpin the algorithms that determine the most efficient uses of land and determine the costs of areas lost due to planned and/or undesirable impacts of human activities.
Random or strongly stratified samples efficiently answer many scientific questions, especially at small scales. However, systematic sampling is usually more logistically efficient for large-scale studies, has less chance of unpredictable bias, and returns smaller standard errors when the intention is to compare temporal changes (Caughley & Sinclair 1994). In addition, it greatly facilitates the production of maps and analyses of spatial patterns (Fortin & Dale 2005).
While it is often feasible to calibrate the different techniques for measuring the same variable, differences in scale and spatial sampling patterns normally preclude comparisons between the commonly used indices used for the evaluation of impacts on biodiversity.
An overemphasis on technical standardization prevents the use of technological innovations. Within a few years, advances in sonar technology will allow the identification of deep-sea fish species, advances in genetics will allow for biota surveys based on DNA fragments and other organic chemicals dissolved in water, and advances in remote sensing already underway are replacing direct measurements of many variables such as temperature and chlorophyll. The system must be flexible enough to absorb new technologies or it will not be accepted by the scientific community, but lack of spatial standardization impedes the efficient calibration of new techniques against the old ones, and makes it impossible to construct long-term time series.
Why does the system have a strong emphasis on sampling associated with contour lines?
The RAPELD system uses plots that follow the contour because this procedure generally minimizes internal variation within the sampling plot. This increases the accuracy of predictive environmental measures (such as soil characteristics and groundwater distance in the terrestrial environment, and depth, light and substrate in the marine environment), which are important for the development of niche models and predictions of distributions under different environmental conditions. For example, Castilho et al. (2010) showed that the models of the accumulation of tree biomass (the main carbon stock) in the Amazon should take into account the soil variation and temporal variation probably associated with climatic variation. Such conclusions would not have been possible using conventional sampling with the same sampling effort.
Accurate models will be needed because the sea is being impacted by large-scale anthropogenic changes that are completely independent of local impacts such as over fishing and oil spills. Monitoring only to detect changes will not be useful without information on the scale of the impacts and the likely causes. For example, we can predict that any point in the sea will undergo environmental changes and changes in its biota in the coming decades simply because the pH and depth will change[3]. Changes in depth will cause changes in currents that result in changes in substrates, the sources of larvae, and other processes known to be critical in determining the biota at any location at sea. Impact evaluations of local activities such as port infrastructure changes or pollution due to spills need to be made in relation to the changes that will occur, regardless of these activities.
Modeling is critical to large-scale studies because of the cost of the sampling intensity that is required for making decisions based on statistical considerations. Without the ability to statistically control the most important variables, this is likely to be out of reach of any potential funding system.
Why emphasize integrated sampling if researchers like to work independently?
Conventional competitive research funding systems cause researchers to work independently and not show their data except in the form of tables summarized in publications. While it is debatable whether this system is efficient in the academic arena, there is no doubt that it is perverse for decision-makers to make decisions based on this data because they need to take into account the interests of multiple users simultaneously and data from individual studies that cannot be integrated have little value. Inaccurate but integrated data is often more valuable to decision makers than accurate data that cannot be integrated with data from other areas.
The highest costs in field research are associated with the installation of infrastructure and the logistics of access to survey areas. On land, access depends on vehicles and walking along trails. In the sea, it depends mainly on boats. Planning in relation to the questions to be answered can greatly reduce the costs of individual research (Santos et al., 2008). However, the main savings can be achieved by the integration of surveys by several researchers using the same infrastructure. At sea, where the highest cost is usually associated with the purchase, maintenance of, or rental of vessels, the savings to be obtained are obvious when several teams can use the same infrastructure and survey areas.
How to get the necessary finance if no single financier can pay all the costs?
Biological and environmental surveys are not cheap, even if they cost much less than the amounts invested in other aspects of the production chain. This leaves large-scale sampling systems that are highly centralized in a single financer very vulnerable to political and economic changes. In reality, such businesses represent mega-projects and not academic institutions. To attract many investors from many regions, the system needs to deliver relevant results to a variety of users at many different scales. In the terrestrial environment the RAPELD system shows how this is feasible. RAPELD is being used and funded from various sources, from entrepreneurs, community groups, state and federal governments, research and teaching institutes, and NGOs. Each contributes different resources at different scales, but the data can be integrated at any scale.
In the long run, the highest costs are associated with staff retention. Limitations on hiring staff and the availability work-placements prevent the creation of a mega-project to cover all aspects of environmental monitoring. However, the mobilization of researchers, analysts, and especially postgraduate students has allowed RAPELD to expand in the terrestrial environment, just as other major monitoring projects have been shrinking due to the global economic crisis.
RAPELD is being applied from within the Biodiversity Research Program (PPBio) through Regional Centers. Different regional centers meet to develop joint research, and these centers are integrated through several larger networks, such as the PPBio Executive Nuclei and CENBAM the National Institute of Science and Technology in the Amazon. The combined potential of all these Brazilian regions is sufficient to ensure important advances in the monitoring of the environment; what is missing, is integration.
Are marine surveys similar enough that they can be integrated with terrestrial ones in interface zones, such as mangroves and estuaries?
Marine-system surveys follow the same methodologies used in the terrestrial environment. Either they are based on linear transects or on plots of varying sizes and shapes. Many aspects of the environment can be monitored by remote sensing (where the plot is the pixel), but most of the variables of interest to decision makers can not yet be measured using remote sensing (e.g. species of economic value, endangered species and most pollutants). Sediment, pollutant, and water fluxes do not obey the arbitrary lines between ecosystems mapped by humans (Beger et al., 2009), and imminent sea level changes will soon shift the boundaries between the sea and the land.
Examples of marine fauna and flora that are often monitored using linear transects include seabirds, marine mammals, plankton and fish species that form large schools and can be detected using sonar. Examples of organisms often monitored in plots include corals, benthic fish and invertebrates, macro algae and marine reptiles. All these groups, and the substrates they occupy, show strong relationships with depth, and predictive models based on plot data with a minimum of internal depth variation (such as RAPELD) allows much more accurate predictions to be made.
Doesn't a systematic sampling system with a restricted scale risk excluding some important processes and organisms?
The answer is yes, but a system capable of studying all possible space and time scales and all organisms simultaneously, simply would not be economically viable. The RAPELD system was based on scales (5km transects and 250m long plots) within which federal, state and municipal decision makers typically work, and easily allows for integration with current remote-sensing systems. However, many more specific surveys may facilitate interpretation of the patterns generated in studies at larger scales. For example, sections of the TEAM Conservation International program, the CTFS 50 hectare and LBA eddyflux towers are nested within RAPELD sites. Some users, such as EMBRAPA in the savannas of Roraima and Griffith University in Australia's urban areas have modified the criteria in order to carry out more intensive sampling,.
The RAPELD system is based on grids and modules, and comparisons require that these sampling grids be standardized at some scales, but this does not indicate that a uniform grid over the entire region is either necessary or desirable. The RAPELD system is hierarchical, allowing for more intensive sampling in some areas, but also giving a uniform coverage over larger areas.
Figure 1 shows a hypothetical design for an area along the Brazilian coast based on considerations determined by meeting participants in São Sebastião. The sampling units used in most RAPELD system are standard modules (2 x 5km transects separated by 1km with 10 uniformly distributed 250m plots) and standard grids (12 transects on a 5km square grid with 30 evenly distributed 250m plots). Places of special interest (such as around oil extraction platforms, local ports, and around marine reserves) can be sampled with standard grids or sets of standard modules. Intermediate areas and linear structures, such as pipelines, can be sampled using more spaced sets of standard modules. This is only an example of how the system could be mounted. The design must be decided in agreement with the various entities responsible for the region.
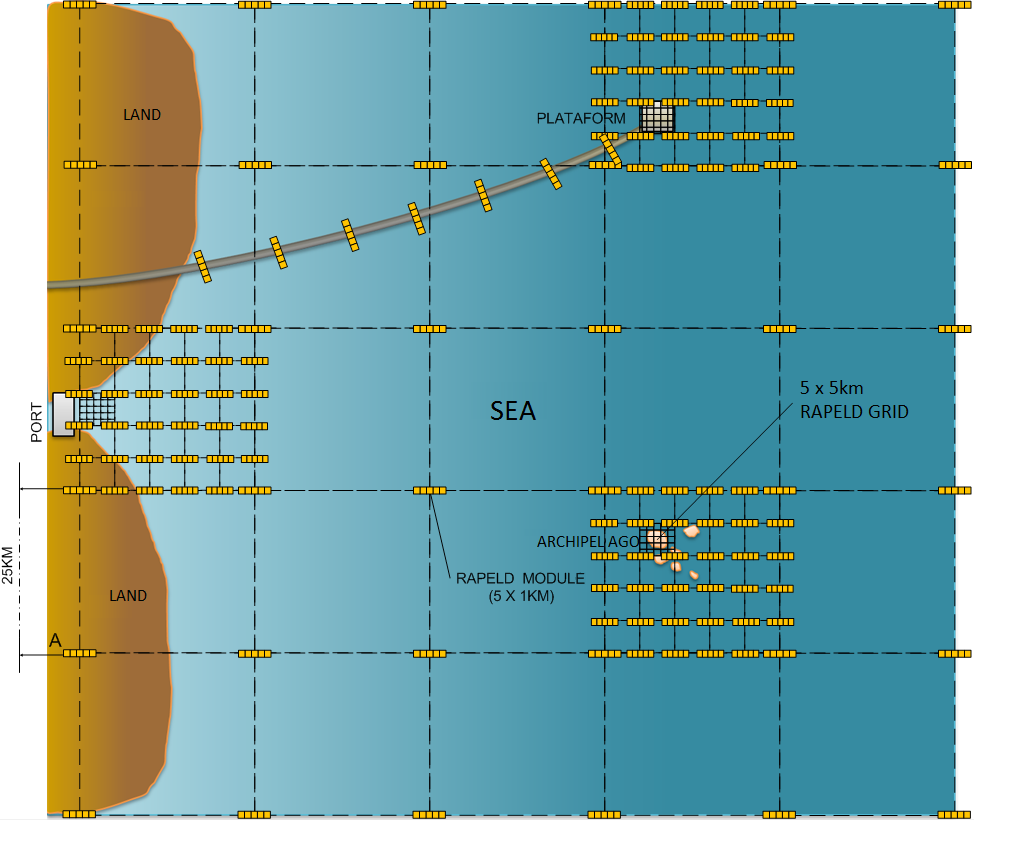
Figure 1. RAPELD system in the marine environment and along a coast. A larger grid covers the different elements of interest (coast, archipelagos, exploration and transportation areas for oil, and open water), with smaller grids covering some of them more intensively.
Do all organisms, environmental variables, and regions need to be sampled within the same time frame?
It is easy and relatively inexpensive to sample variables, such as total chlorophyll or seabird density. However, predatory-fish surveys, may require more effort and financial resources. High frequency sampling of benthic organisms in permanent plots can modify the substrate and lead to spurious conclusions about temporal changes. Monitoring requires regular sampling over time, but the sampling interval should be optimized for each target group in terms of costs, the available technology, the ability to economize by carrying out joint surveys with other groups, and the need for information to make decisions.
Surveys along linear transects, such as for birds and marine mammals can be undertaken regularly (several times a year) during trips to supply oil-rigs, research stations and other routine activities at little additional cost. Permanent-plot surveys using traps or underwater video cameras can be undertaken relatively frequently (e.g. annually) at intermediate costs. Surveys that potentially cause disturbances such sampling the benthos by removal of the substrate, and high cost surveys, using divers at greater depths for example, can be carried out at longer intervals (e.g. every 5 - 10 years). It is the responsibility of the coordinating committee to maximize the frequency of surveys for each group in each area within the limits of current technologies, and the available financial and human resources, according to the priorities of the decision makers.
Can't decisions be taken using the data that is already available?
Several authors have estimated that the cost of validating, storing and making data available varies from between 15 to 20% of the total cost of the program. It is this investment that is missing for almost all monitoring activities worldwide. Here, we are only dealing with data obtained from using the RAPELD system, not any costs to retrieve data already available or to acquire the high density data available through remote sensing. The latter may contribute to analyses, but its most important shortcoming is the lack of data on the distribution of in-situ biodiversity. It is this lack of locally-collected data of sufficient quality and distribution to create reliable GIS layers that is impeding the use of biodiversity data by decision makers.
The lack of reliable data does not result from a lack of biological surveys. Hundreds of millions of dollars are spent annually in Brazil on activities assessing environmental damage and monitoring the impacts of large-scale enterprises, but these data are not available to the public and are not accompanied by the metadata that would enable them to be used in meta-analyses. That is why IBAMA-DILIC, ICMBIO and SFB are working to incorporate RAPELD into EIA-RIMAS (Environmental Impact Studies and Reports) and other mandatory terrestrial monitoring programs.
Despite enormous advances in the field of computer science, the dearth of data availability is currently one of the biggest impediments to science. There are many large databases in the world, but with the exception of some very specific ones, such as GENBANK, most are empty (Nelson 2009). It is not only a problem for decision makers. Most of the most renowned scientific journals in the areas of ecology and evolution are now refusing to publish articles if the original data are not available on the internet in freely accessible repositories (Bruna 2010, Pullin & Salafsky 2010, Whitlock et al.) It is not a question of lack of investment in information technology, which is one of the areas of technology that receives the most finance. There is a need for investment to train researchers in data management, and there is a scarcity of professionals at the interface between research and computer science to validate the data and help researchers with the difficult task of making their data available and useful to other users. One of the main reasons for RAPELD's success in the terrestrial environment was the investment in personnel in this critical area.
How much does it cost to implement the RAPELD system?
RAPELD was designed to return more useful information to decision makers than any other on-site monitoring system over large areas for a given effort. The fact that there is no other competing integrated system indicates that its users consider that RAPELD is fulfilling this objective. However, the effort depends on available resources, and the purpose of the system is to integrate a range of funding sources that all contribute towards the same goal, while still ensuring that each user obtains the required results. RAPELD's success depends on the ability of the coordinating committee to recruit partners that have already invested in the infrastructure (e.g. vessels, human resources, deep diving equipment and so on).
If you add up all the investments already made in infrastructure, the total cost of any monitoring system over large areas is massive (of the order of hundreds of millions to billions of dollars). This applies to both terrestrial and marine environments. Fortunately, several organizations; the Ministry of Education, the Ministry of Science and Technology, the state governments, the Navy, and companies such as Petrobras, have already made many of the necessary investments. New investments in infrastructure should only be made after optimizing currently-available resources.
An assessment of new investment requirements can only be made after meeting with the users, assessing the available resources, and determining the data accuracy required for each region or location. Setting up yet another marine research institute or reinforcing funding for current programs to continue their routine activities will not solve the problem. The only costs that can be precisely defined are related to program coordination, training, and the maintenance of the generated database. Typically, total research costs are underestimated because funding agencies do not provide resources for long-term salaries or buildings. The problem for extremely important and long-term databases is that no biodiversity institute is currently investing in this area. If the total costs of all sources are to be considered, the Brazilian Ministry of Science, Technology, Innovation and Communication (MCTIC) was investing around US$ 1,000,000 per year in the RAPELD system in the Amazon. However and the system is deficient in several areas, especially in relation to the hiring of permanent staff for the maintenance and digital curation of data. These figures do not include infrastructure maintenance costs or the salaries of researchers and of most of the technicians involved.
Assuming that they can not be obtained from partners, the initial minimum costs for a coordinating body, include the following (figures are purely illustrative):
(1) A building and furniture to house personnel and computer equipment (US$ 300,000).
(2) Hiring 4 doctors, 4 masters, 4 computer technicians, and 3 secretaries (US$ 600,000 per year).
(3) Meetings and workshops to involve all users and define responsibilities (US$ 150,000 per year).
(4) Computer equipment and services (US$ 70,000).
These prices may be reduced if the program can use existing employees and/or buildings. However, it is important to emphasize that any investment, without coordination, even for projects other than RAPELD, will not provide decision makers with biodiversity and environmental data any more useful that those already in existence.
Hyper-Links:
[1] https://ppbio.inpa.gov.br/noticias/encontross/ssebastiao
[2] https://ppbio.inpa.gov.br/en/home
[3] http://www.ocean-acidification.net/
[4] https://ppbio.inpa.gov.br/en/Biodiversity_and_Integrated
References:
Beger, M., HS Grantham, RL Pressey, KA Wilson, EL Peterson, D. Dorfman, PJ Mumby, R. Lourival, DR Brumbaugh & HP Possingham. 2009. Conservation planning for connectivity across marine, freshwater, and terrestrial realms. Biological Conservation doi: 10.1016 / jbiocon.2009.11.006.
Bruna E. M. 2010. Scientific Journals can Advance Tropical Biology and Conservation by Requiring Data Archiving. Biotropica. 42: 399-401.
Caughley, GC & AR E. Sinclair. 1994. Wildlife Management and Ecology. Blackwell Science, Cambridge, MA, USA.
C.V. Castilho, W.E. Magnusson, R.N.O. Araújo, R.C.C. Luizão, F.J. Luizão, A.P. Lima, N.Higuchi. Variation in above ground tree live biomass in a central Amazonian Forest: effect of soil and topography. Forest Ecol. Manag., 234 (2006), pp. 85-96
Costa, FRC & WE Magnusson. 2010. The need for large-scale, integrated studies of biodiversity - the experience of the biodiversity research program in. Nature &Conservation 8: 1-5.
Fortin, M.-J. & MRT Dale. 2005. Spatial Analysis. Cambridge University Press, Cambridge, UK.
Magnusson, WE et al. 2013. Biodiversity and Integrated Environmental Monitoring. Áttema Editorial, Santo André, SP [4].
Nelson B. 2009. Data sharing: Empty archives. Nature 461: 160-3.
Pullin. S. & N. Salafsky. 2010 Save the Whales? Save the Rainforest? Save the Data! Conservation Biology. 24: 915-917.
Santos, EMR, E. Franklin & WE Magnusson. 2008. Cost-efficiency of subsampling protocols to evaluate oribatid-mite communities in an Amazonian savanna.Biotropica 40: 728-735.
M Whitlock. C., MA Mcpeek, MD Rausher, L. Rieseberg & AJ Moore. 2010. Data Archiving. The American Naturalist. 175: 145-146.
