Languages
Calculation of the plot
Updated: Aug 17 2018. Tim Vincent.
 |
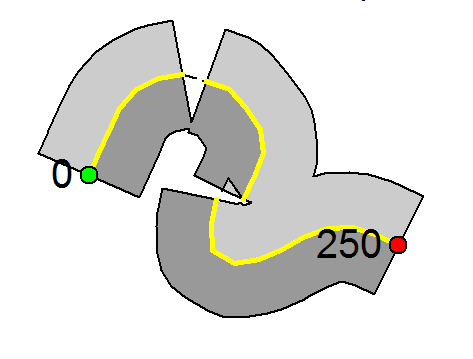 |
| Fig 1: Sample (click to enlarge) | Fig 2: Calculate Area Sampled |
The RAPELD plots follow the ground contour. This feature minimizes the variation of topography and soil types within plots, and allows the use of these variables as predictors of species distributions. Plots do not necessarily follow a straight line and can present a winding path. Depending on the organism to be studied, the sample along the plot varies in its width (see chapter 3 of the Biodiversity Monitoring book). For example, soil fungi have a width of 25 cm and big trees (over 30 cm DBH), 40 m.
To enable more precise area calculations for any of the standard study groups we have developed an R package that provides a user friendly solution to calculate the area of RAPELD plots.
We have step by step tutorials to download that show recommended processing steps with R and QGIS:
R tutorial: PDF
QGIS tutorial: PDF
This package takes compass bearings and distances recorded during plot installation and then:
-
derives coordinates and calculates the survey area of nonlinear plots.
-
exports .pdf files showing plots
-
exports calculated areas as .csv
-
Exports plot center lines as shapefiles and .kml
