Languages
The Installation of Permanent Plots on a RAPELD Grid.
Permanent plots
 PPBio installs and maintains permanent plots for long-term ecological research. Each research site can, depending on the environmental heterogeneity, contain various types of permanent plots. There are permanent survey plots that are evenly distributed along the grid or module trails which are commonly used to sample abundant organisms, such as insects, herbaceous plants, fungi,amphibians, reptiles, etc. There are also permanent plots for sampling aquatic organisms such as fish and aquatic insects in small water bodies, riparian plots for organisms that live on the margins such as semi-aquatic vegetation and amphibians and for organisms that use larger bodies of water like caymen and turtles. For organisms that are normally rare in the environment such as commercially important trees, or large mammals, the main grid tracks are used as line transects.
Uniformly Distrubuted Permanent Plots.
 These plots follow the ground contour. This feature minimizes variation due to topography and soil types and allows the use of these variables as predictors of species distributions. The design can be used for a wide variety of different taxa by adjusting the width along the plot (see Magnusson et al., 2005 for details). The number of plots installed depends on the type of research site (module or complete grid). The complete grids contain 30 permanent plots (Figure 1). The number of survey plots will vary depending on the size and format of the module. For example, there are 12 plots installed on this module installed along the BR-319 (Figure 3).
Figure 1. Diagram showing the location and size of a RAPELD grid and permanent plots.
Installing the Permanent Plots
 The 250 m long plots are evenly distributed over the grids or modules with 1 km between them. The center line is made by at least two people and an inclinometer (device that measures the slope) or theodolite is essential. The center line of the plot, which follows the contour of the land is always in straight 10 m segments (Figure 2). These centerline is marked out with plastic secured to pickets made of white PVC pipe of 1/2 inch diameter and 50 cm in length (20 cm buried and 30 cm above ground). Each picket has an aluminum plate indicating its length along the center line. The first picket is 10 m away from the main track on the same contour as the picket on the main trail. The plots are located 500m from intersections in order to minimise disturbance from the trails.
The basic procedure for marking out a plot is as follows: From the point on the main trail where you want to start the survey, one person stands on the main trail with the inclinometer and the other moves to the RIGHT of the track to a distance of 10m. Now, the person on the main trail directs the assistant to a point that is at the same level. When this has been determined check that the previously estimated distance from the main trail picket is 10m. Recheck with the inclinometer. This point will be marked with a picket and an aluminium tag "0m". A string can be tied to the this picket from the one on the main track. Place a blank picket 1m to the right of the "0m" picket. This will be the other side of the movement corridor down the center of the survey trail.
Use the inclinometer to locate the next point on the same contour that is 10m away. The second picket has a tag "1m". 1m to it`s right will be the second picket of the corridor. Tie string between the pickets to leave two parallel strings 10m long and 1m apart. (Figure 4). Note that up to this point in the process no element of vegetation should be cut. Once the limits of the corridor are known, plants less than 1cm in diameter should be cut close to the ground and left lying in the corridor. The process continues until the survey trail is 250m long.
The process is simple, however, some problems may occur during the installation process:
The plot crosses a main trail (Figure 2 – a):
Depending on the topography, the center line of a plot may cross the main track of a grid (or module) (Figure 2 - a). Since the vegetation along the the trail has been altered, this section can not be considered as an effective part of the plot. In this case, one should disregard these segments and add them to the end of the plot (Figure 2).
Angles between segments less than or equal to 70 ° (Figure 2 - b):
Since permanent plots follow the contour, they are not necessarily straight and may be curved. Depending on the organism to be studied, the varies in its width. For example, for soil fungi the plot is 25 cm wide and for big trees (over 30 cm DBH), 40 m. When the angle between two segments (three pickets) is smaller than 70 ° (Figure 2b), the overlap between the sampled area (in the case of large trees, for example), is very large. Thus, it was determined that an angle equal to or less than 70 ° is not acceptable. When this occurs, the second segment should be ignored and an extra 10m segment added at the end of the plot (Figure 2).
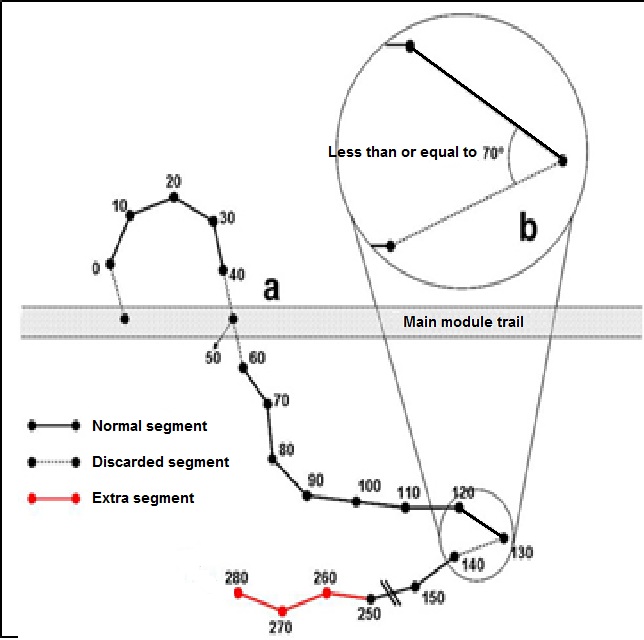
Figure 2. Possible problems during the installation of permanent terrestrial plots. Only the center line is represented. a - segment crosses the trail; b - angles less than or equal to 70 °.
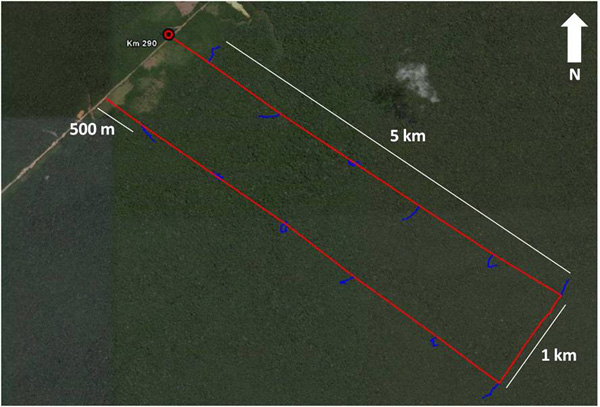
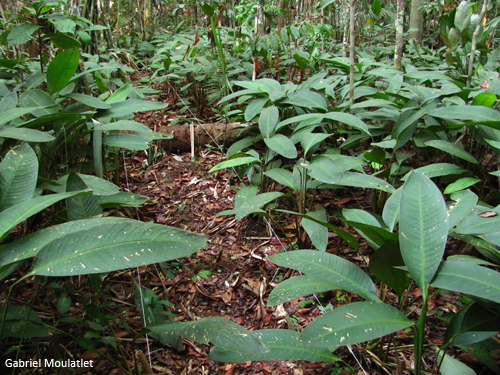
Figure 3. Example of RAPELD research module installed at Km 290 of BR-319 - AM.
Figure 4. Example of central corridor of the plot, where researchers should walk.
PPBio Portal was developed by the management team of Data Repository PPBio/CENBAM · Copyright © 2012 · All rights reserved
2.936 André Araújo AVE - Petrópolis - Zip Code 69060-001 - Manaus-AM-Brasil
Post Box: 2223
