Languages
Standardizing the Scale of Surveys
Most researchers use laboratory or collection techniques that are standardized and there is always much debate about which standards to adopt. However, new and better techniques are continually found. It is practically impossible, and indeed not very useful, to try and restrict regarding what kind of reagents or traps a researcher might use, or any other means of studying their organisms of interest.
In reality, this is not as big a problem as it at first appears, and it is often possible to calibrate new methods so that they can be compared with data collected previously with other methods. However, data collected at different geographical scales usually cannot be compared easily (Urban 20053). Biodiversity measures such as species richness and community composition, the extent of genetic variability within a species, and changes in such aspects as biomass and productivity, all are strongly dependent on scale. This is the reason why practically impossible to use many of the extensive databases that have been developed over the past four decades to support the management or understanding of what determines the distribution of biodiversity.
Using savanna-based data from studies funded by the PPG7 (Cintra 2002), and studies in tropical forests funded by CNPq (National Council for Scientific and Technological Development ), researchers at the PELD site 1 plot series and those participating in the early stages of PPBio’s development thoroughly discussed possible sampling methologies. The result, the sampling system at Reserva Florestal Adolpho Ducke (Ducke Reserve) initially covered covered 64 km2 and served as a means of field-testing the methodology. However, an area this size is simply too big to be put in place at a large number of sites. Studies by Carlos Peres at the University of Anglia (UK) and colleagues showed that straight 5 km transects are sufficient for surveys of most large mammals, and that a sampling system covering 25 km2 (5 km x 5 km) can be implemented at moderate cost.
Using a system of this size, permanent terrestrial study plots are separated by a minimum distance of 1 km, providing a reasonable number of replicas (30-60) for studies on the same site. In addition, in Central Amazonian tropical forests topographic variables are generally not spatially auto-correlated for plots separated by such distances (Kinupp 20055 & Magnusson; Magnusson et al. 2005).
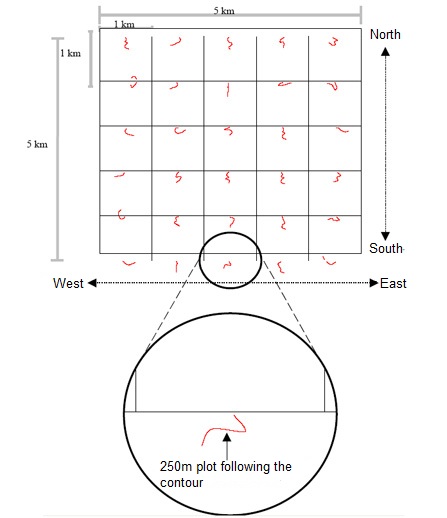
The length of each plot was set at 250 m, because such a length would include a sufficient number of larger organisms, such as trees, to allow analysis of communities. This plot length was independently selected by Alwyn Gentry in his studies in forests around the world and has proved to be valuable and viable in many analyzes (Phillips & Miller 2002). One important diference is that, while Gentry’s plots were straight, PPBio plots are often curved since they follow the regional contour in oder to minimize edaphic variation within plots. (Magnusson et al. 2005) explain the reasoning behind this.
The 25 km2 grid at Ducke is appropriate for studies of populations of most organisms. Such a grid is suitable for hydrological and hydrochemical studies in watersheds, as well as studies of erosion, distribution of introduced organisms, biomass change and other processes that occur at the landscape scale and which are important for professionals involved with such aspects of land-use as management of and forests, parks and reserves. It was therefore adopted as the basic unit for PELD sites. Smaller modules (read more) are used for rapid assessments, but they need to keep the same spatial arrangements as the larger grids in order to maintain comparability with PELD sites and other surveys. Such a design is consistent with the hierarchical approach recommended by Lawson et al. 2005.
Taxonomists often consider field surveys to be a way of producing local species lists. However, these are of very limited use for planning land use, establishing extraction quotas, estimating resource values or other activities of interest to many users. Planning land use requires information on biotic complementarity between sites (Margules & Pressey 2000) and this can be determined in complete surveys (inventory) or surveys carefully standardized for geographic relationships between sampling modules. Complete surveys are financially unfeasible for most taxonomic groups (Magnusson et al. 2005; Ribeiro 1995). Thus, the standardized sampling allows the evaluation of false absences (MacKenzie et al. 2003; Field & Possingham 2005; Huettmann 2005; MacKenzie 2005; Manley et al. 2005; Vojta 2005), and enables data analysis using methods that are little affected by these (e.g. Reyers et al. 2002), which is essential for efficiency surveys. Standardization is a prerequisite to quantify the uncertainty and the estimation of false absences is the first step in the management of landscapes for conservation when operating under the taxonomic and distributional uncertainty that characterizes work in the Amazon (Burgman et al. 2005).
