Languages
Making Use of Data on SiBBr
PDF Version - Click here.
The process of repatriation of data related to Brazilian biodiversity began in
2014 and now there are over 6.3M records 4.3+M of which are georeferenced.
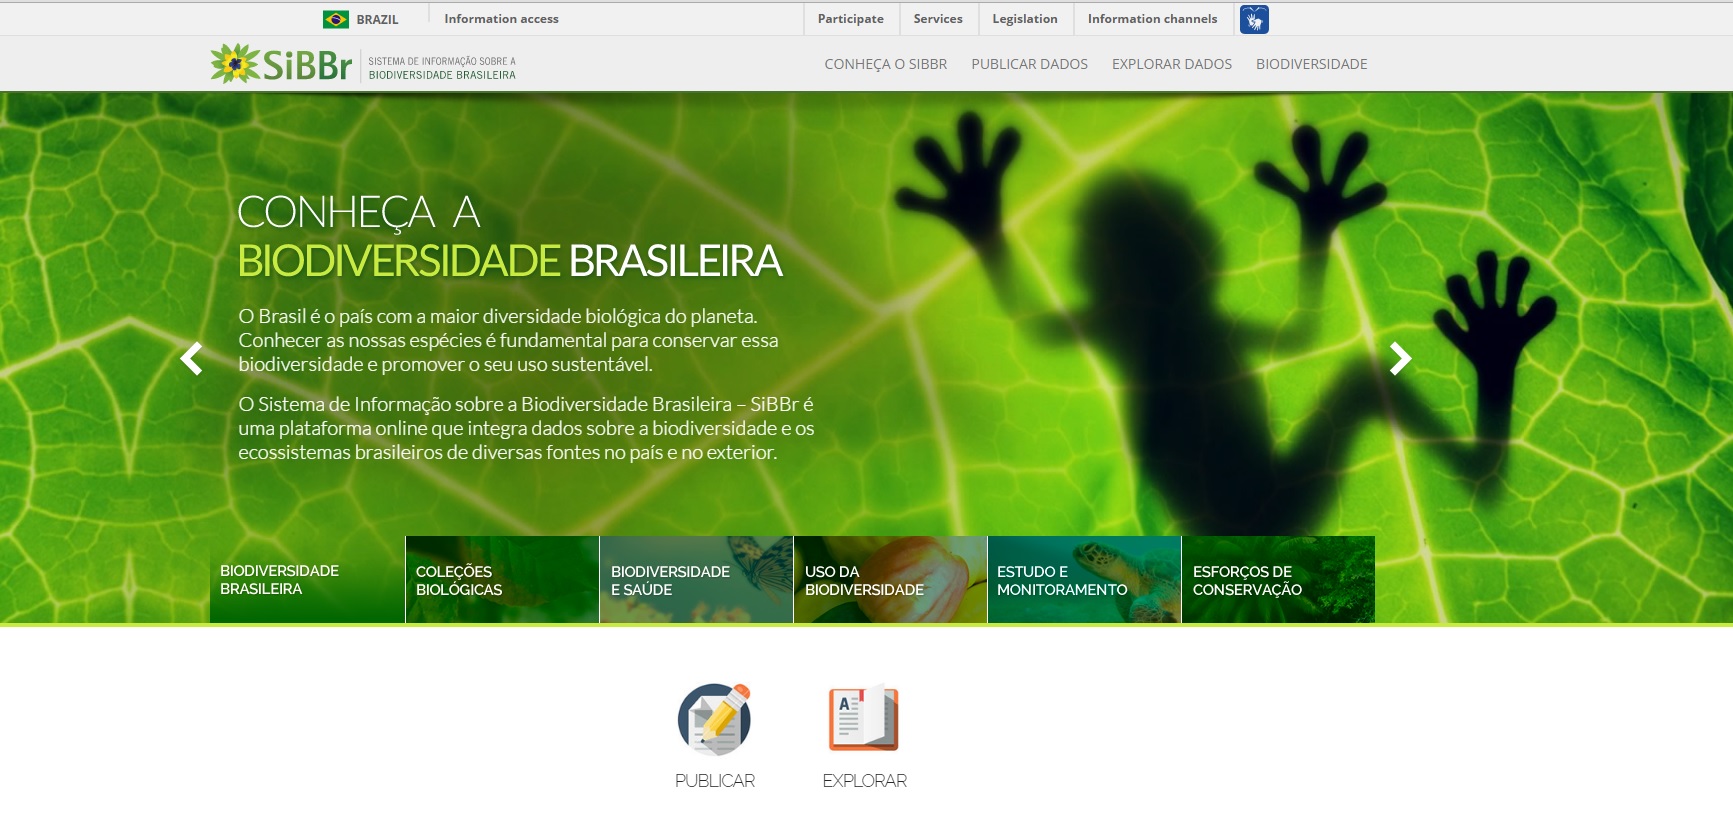
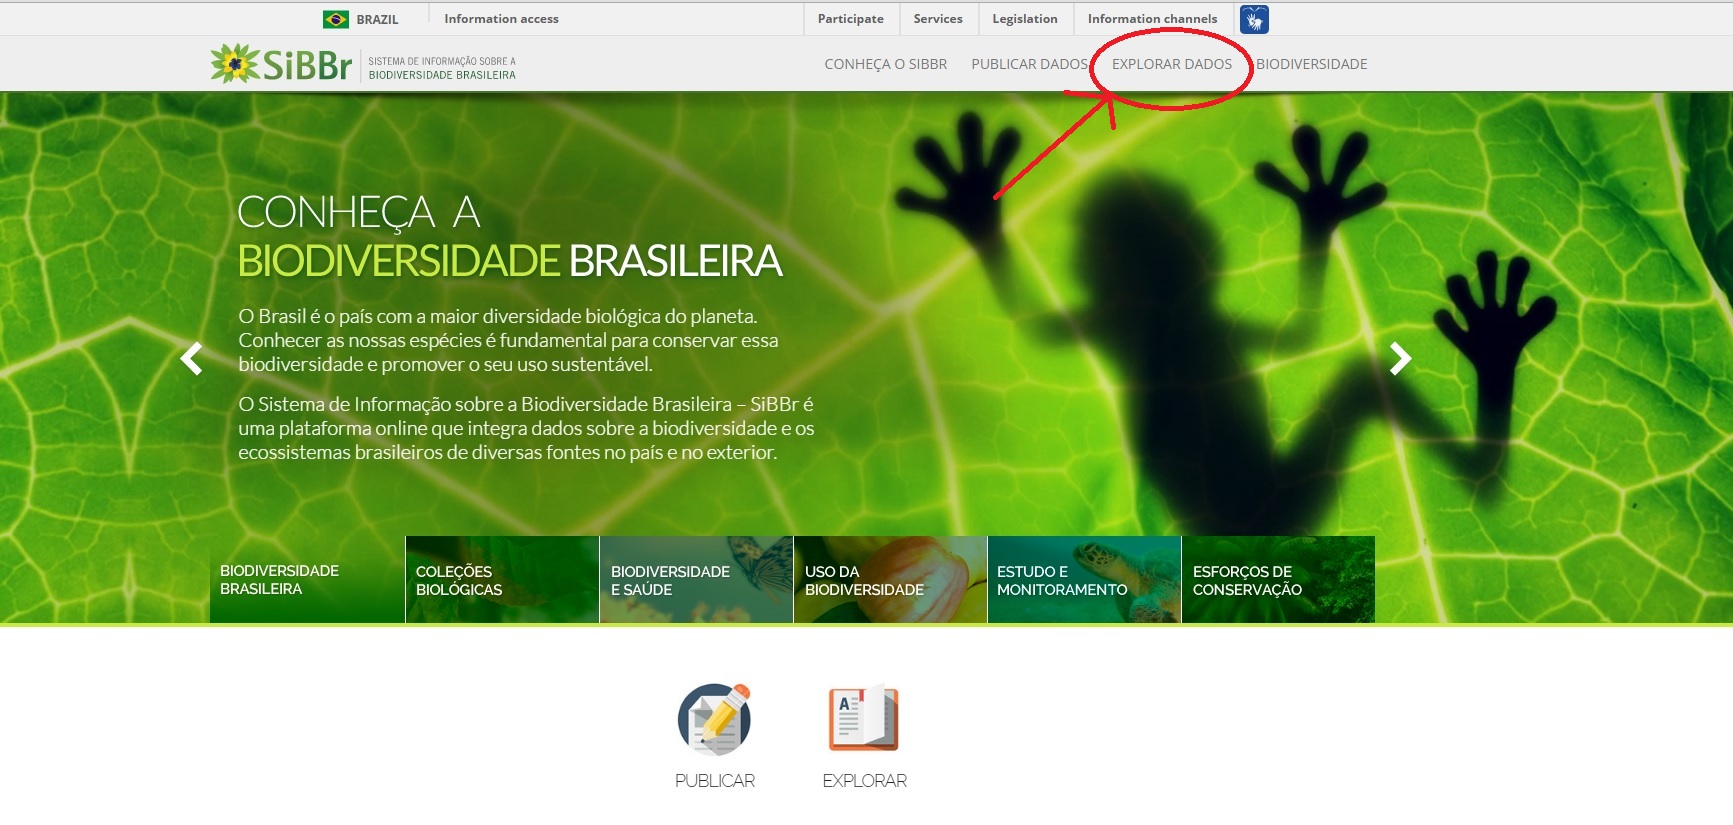
To find this data go to the Explorar dados tab on their website.
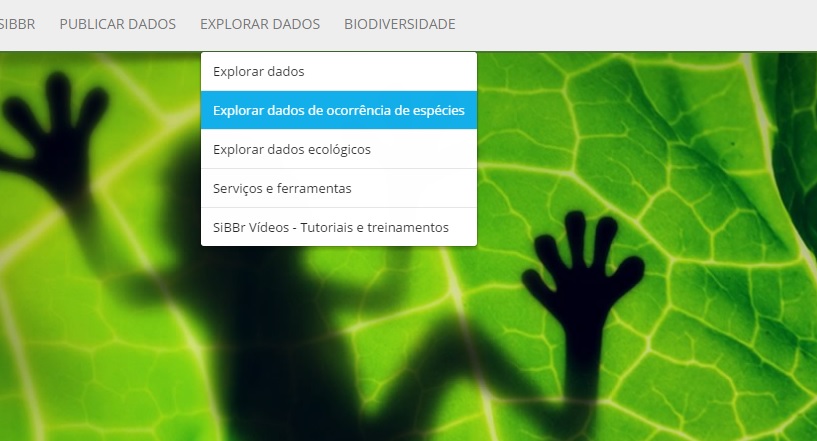
And select the Explorar dados do ocorrencia de especies option
First you will be presented with a map showing all the georeferenced datasets
collected by SiBBr.
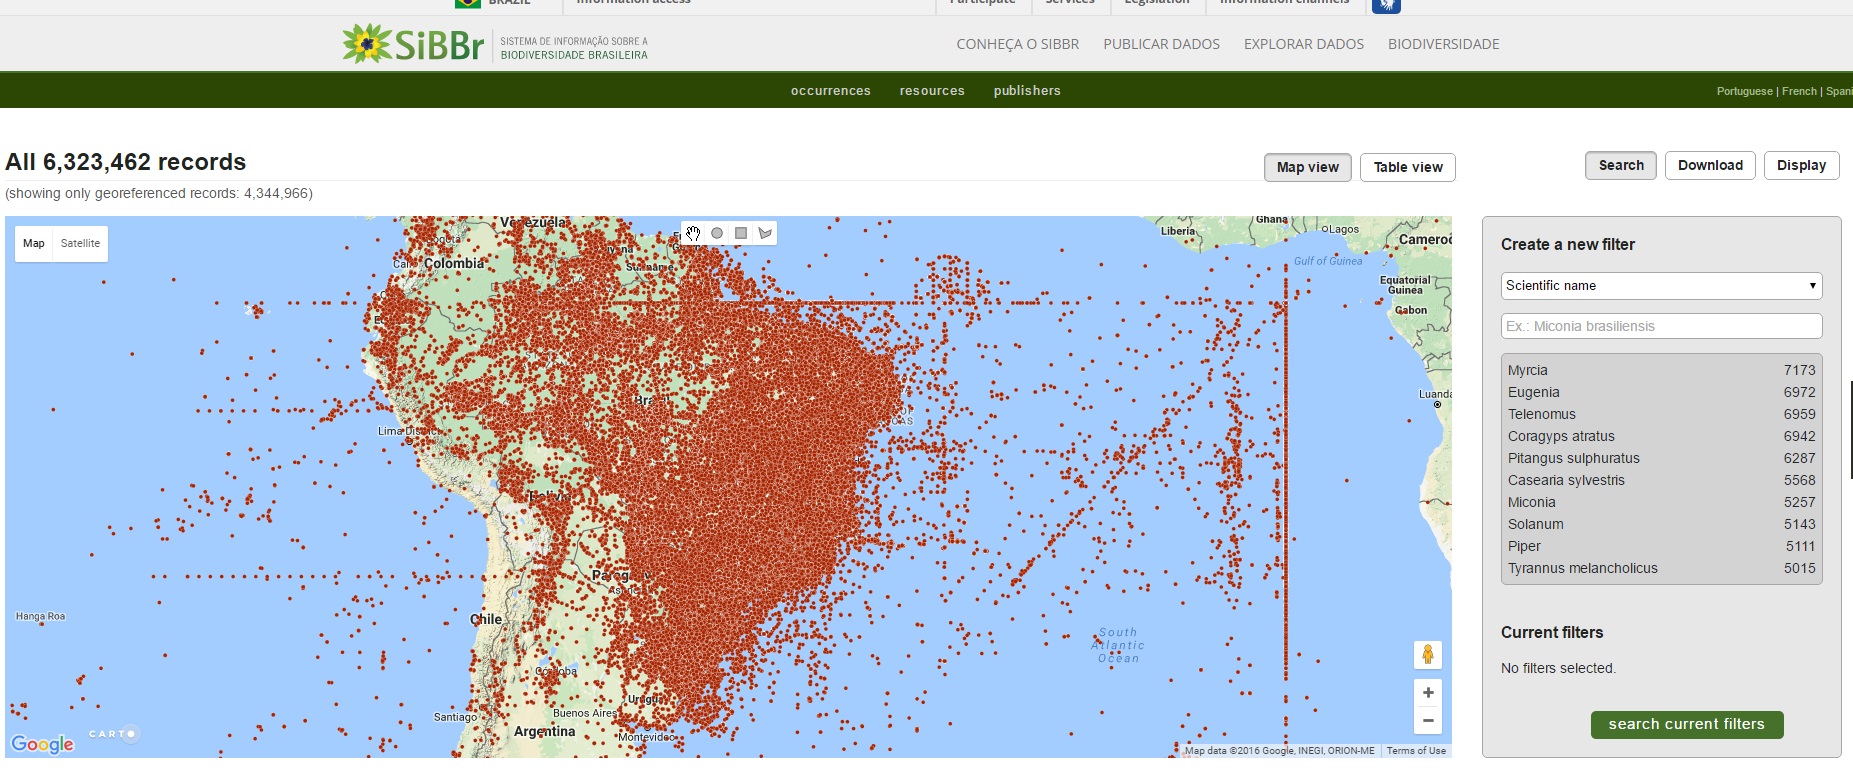
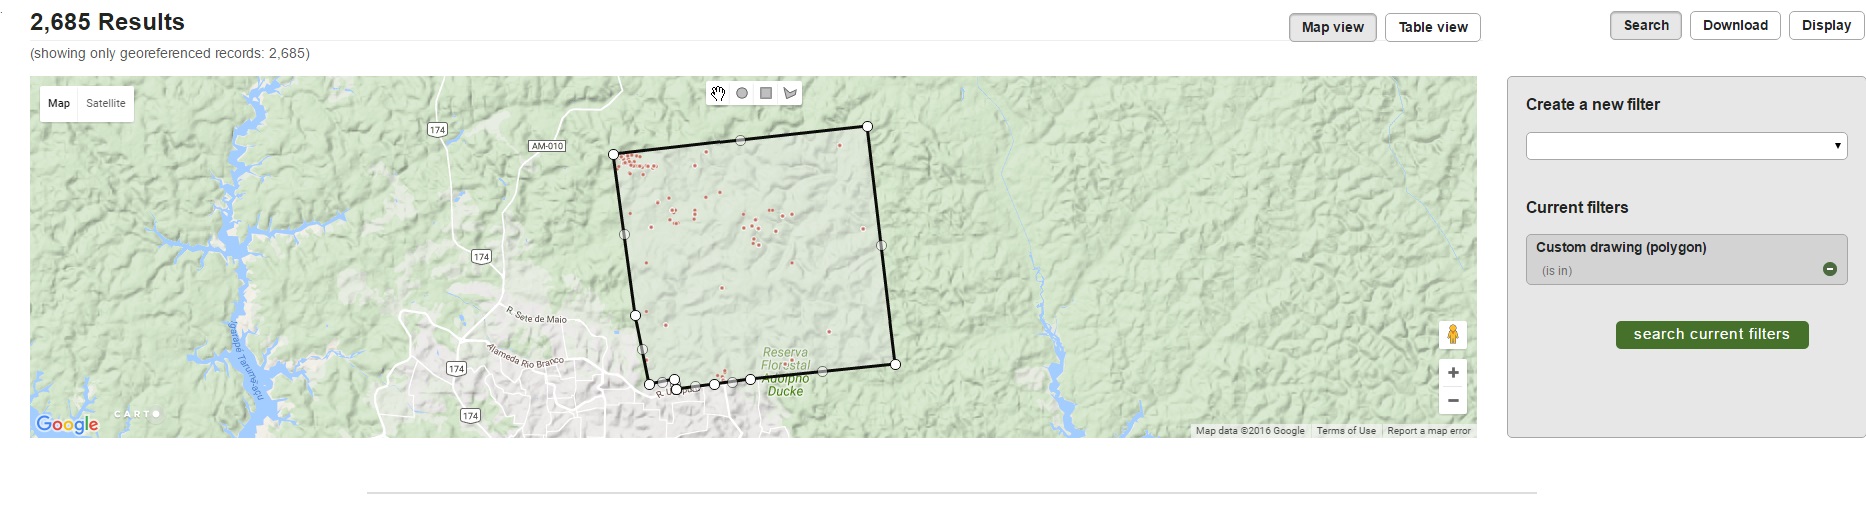
You can zoom in to an area of interest and select all the datasets within an area
of interest.
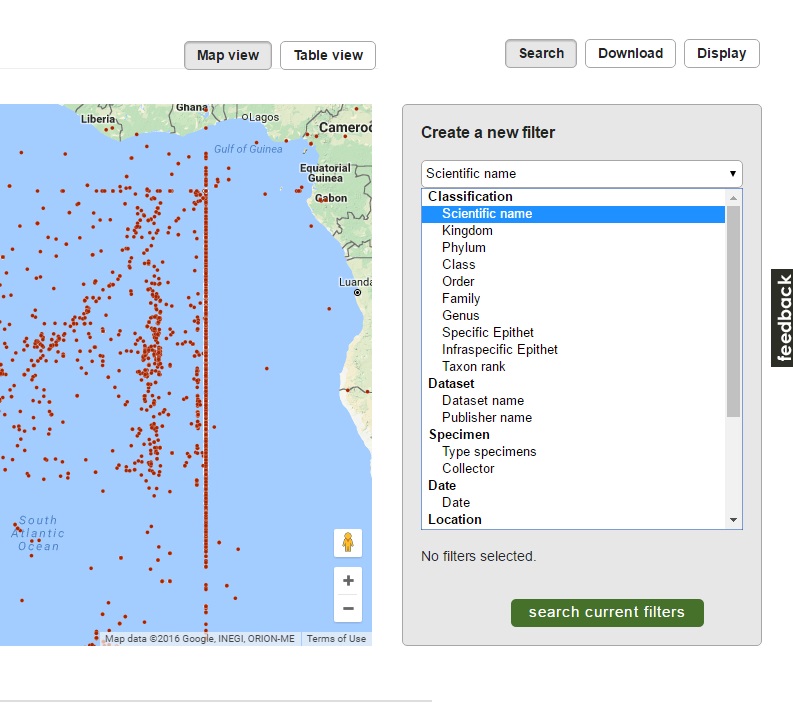
Or you can select by species or genera and so on
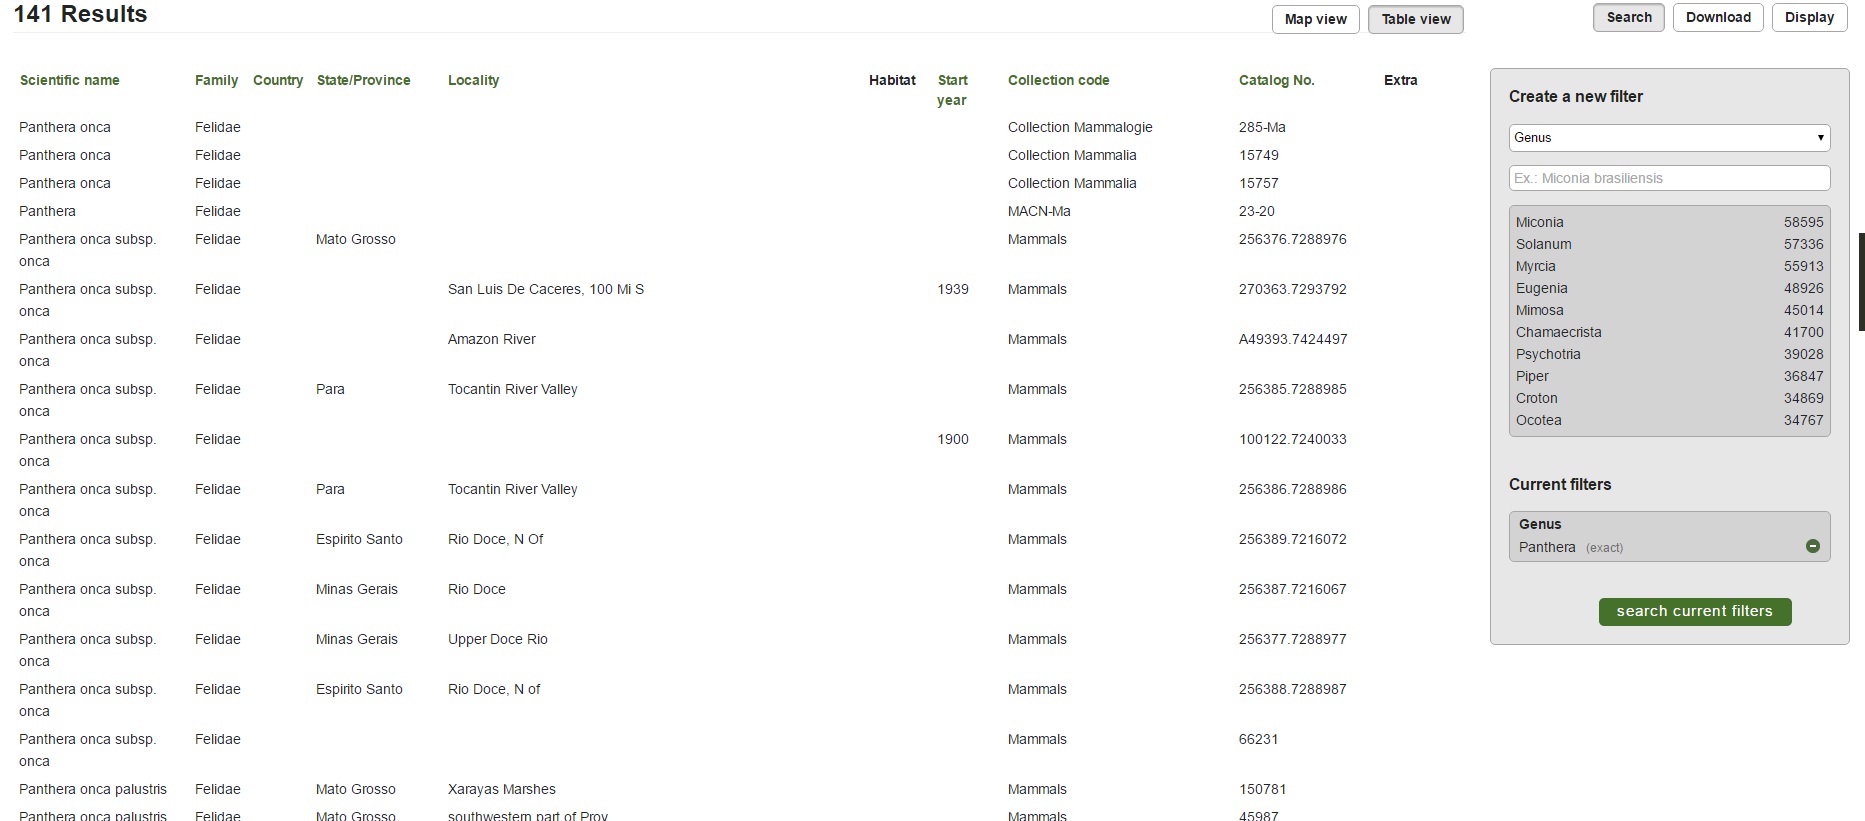
This example shows all the records for the Genus, Panthera.
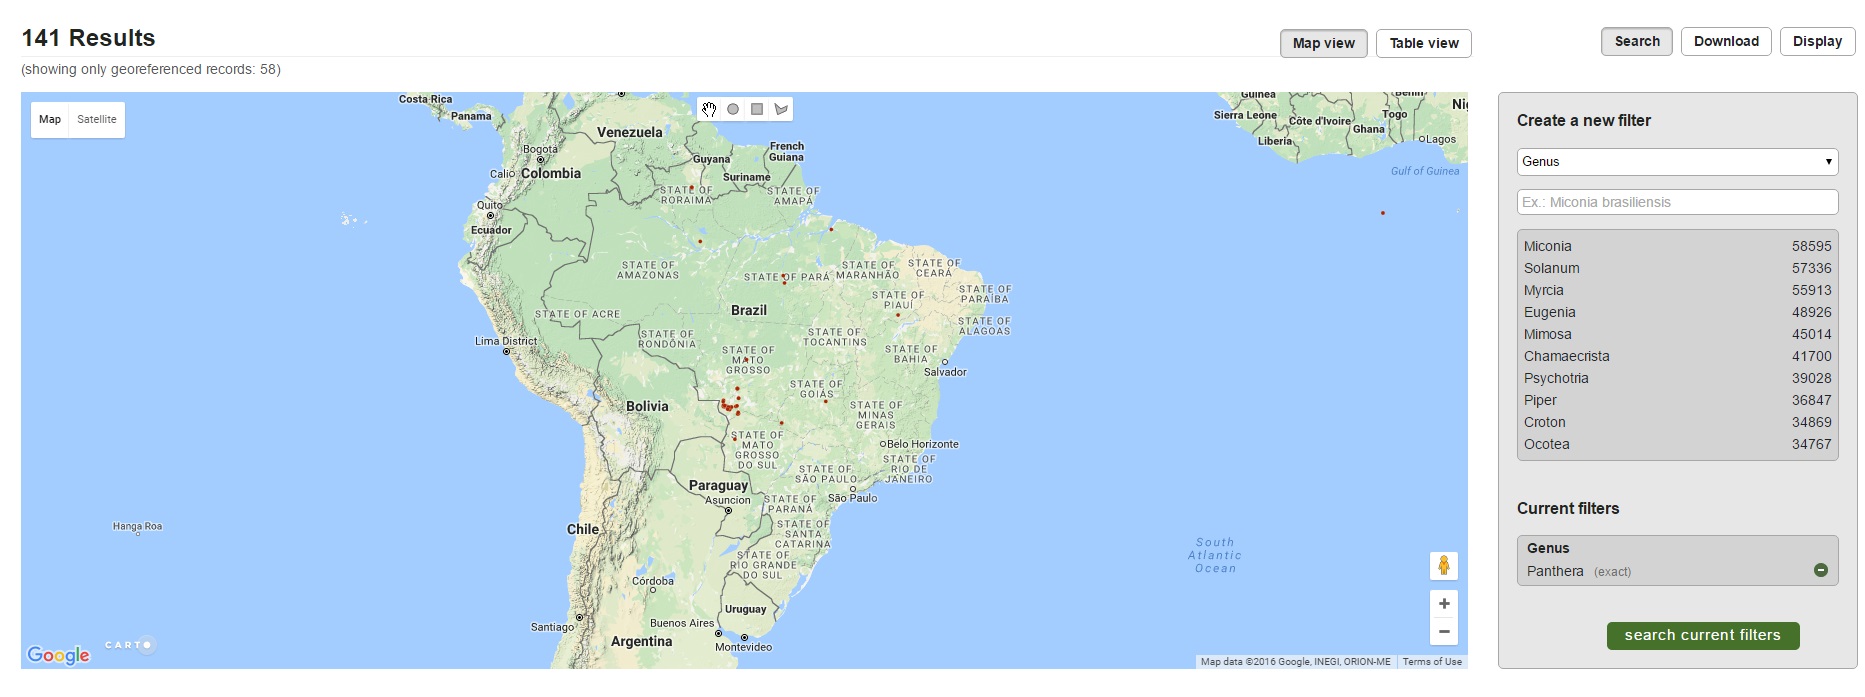
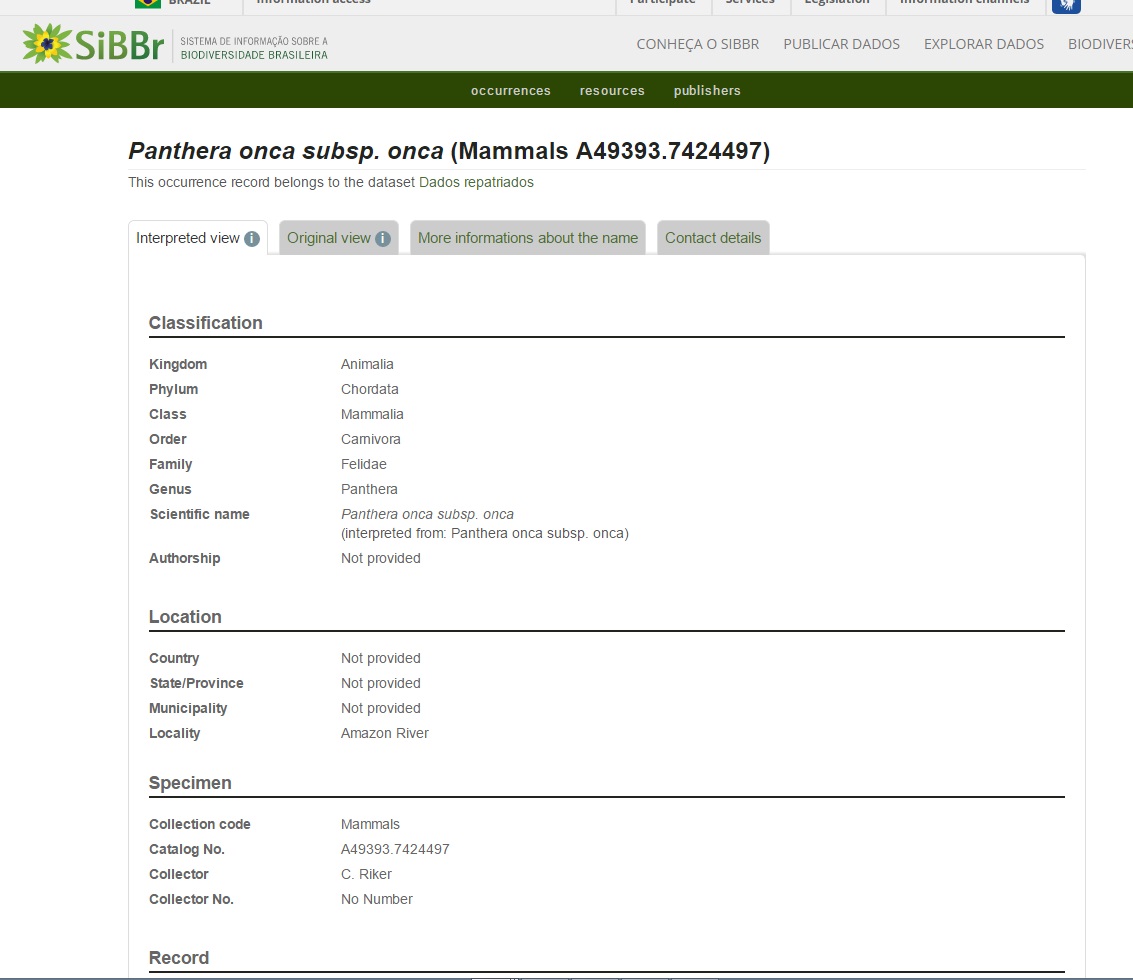
The results show georeferenced records as points on a map which can be
individually selected to display any associated information.
You can list the results in a table.
To obtain a copy of these results for study enter your email address and request
a download.
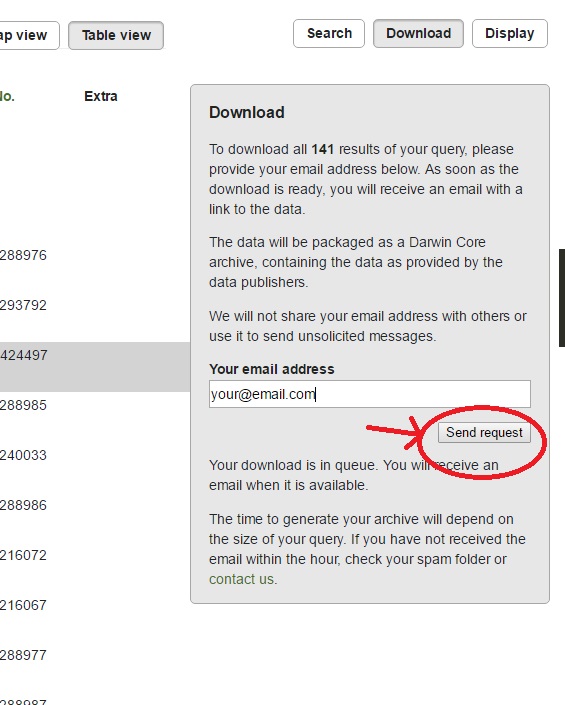
You will receive a text file which can be imported into a spreadsheet.
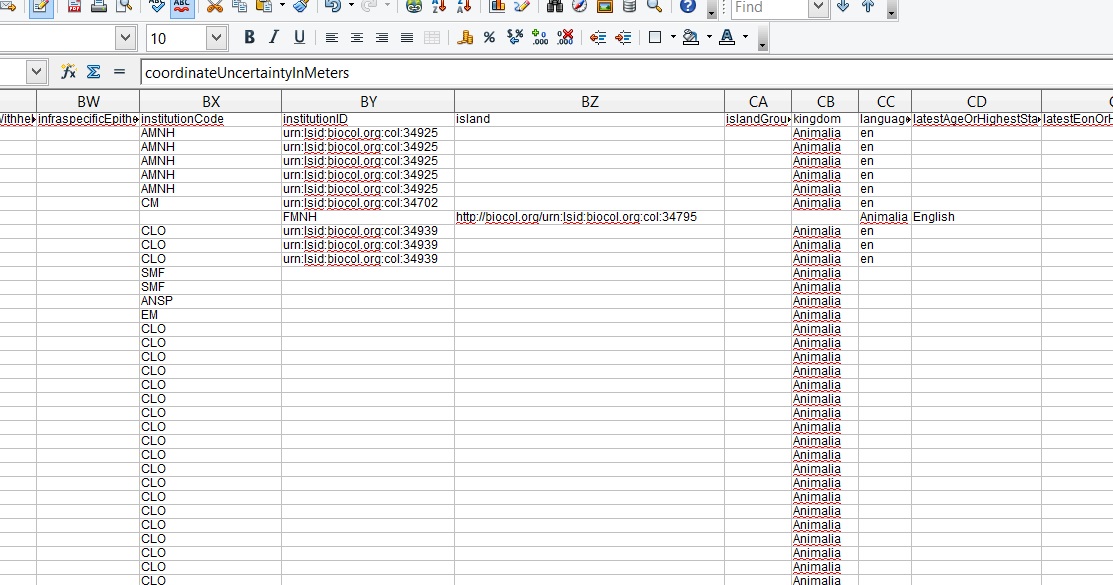
The spreadsheet will need to be tidied up. There are many columns that are
blank or contain repeated data and there are often data entries which may be in
the wrong column or need reformatting. The quality of the data depends on the
original data entry. It is not modified or changed by SiBBr.
For example, some entries here are shifted across by one field.
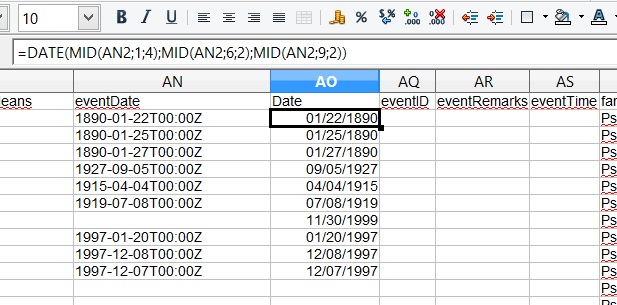
The column displaying the date of the record, is a mixture of date and time
according to international standard ISO 8601:2004(E) and is the Darwin Core
standard.
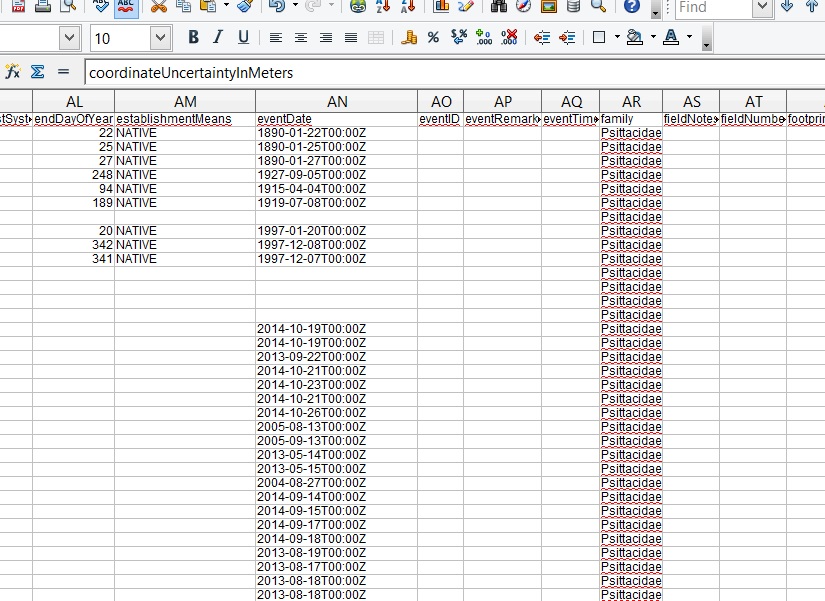
It can be modified as follows:
First insert a blank column and then use the function
=DATE(MID(AN2;1;4);MID(AN2;6;2);MID(AN2;9;2))
to separate the relevant parts and put them into a date format of your choice.
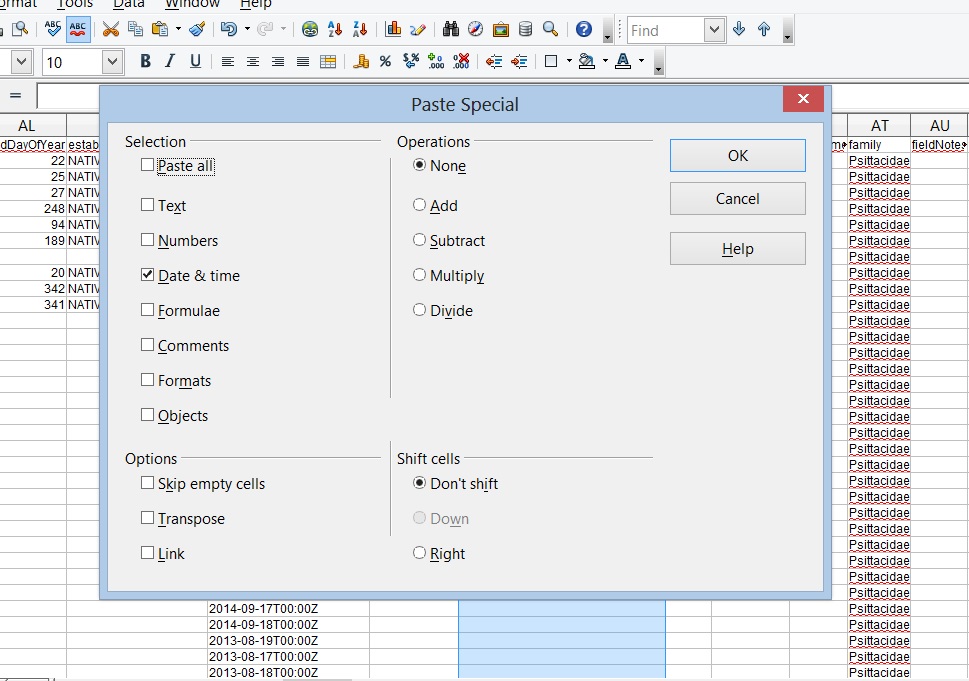
To fix the date as numbers and remove the function you need to copy or cut the
column and use paste special.
There are various additional fields giving information on bahaviour and location
which can be assembled together into one field (if required) by using the text
function CONCATENATE.
Example of a tidied up spreadsheet.

A convenient (and free) tool for displaying this data is Google Maps.
The spreadsheet can be saved in .csv format which can be inserted into a
Google Map. Enter google maps logged on with a google account and select your places and
then the MAPS tab. Then select Create Map. Choose a file to import and then
select or drag and drop the csv you just created.
You will be asked to select the columns that contain your latitude and longitude,
and then the column that you want as the label for each place marker. - Could
be the date or species name, depending or what you want.
That's it. You can change the type of place marker and add more layers for
different species or whatever is useful.
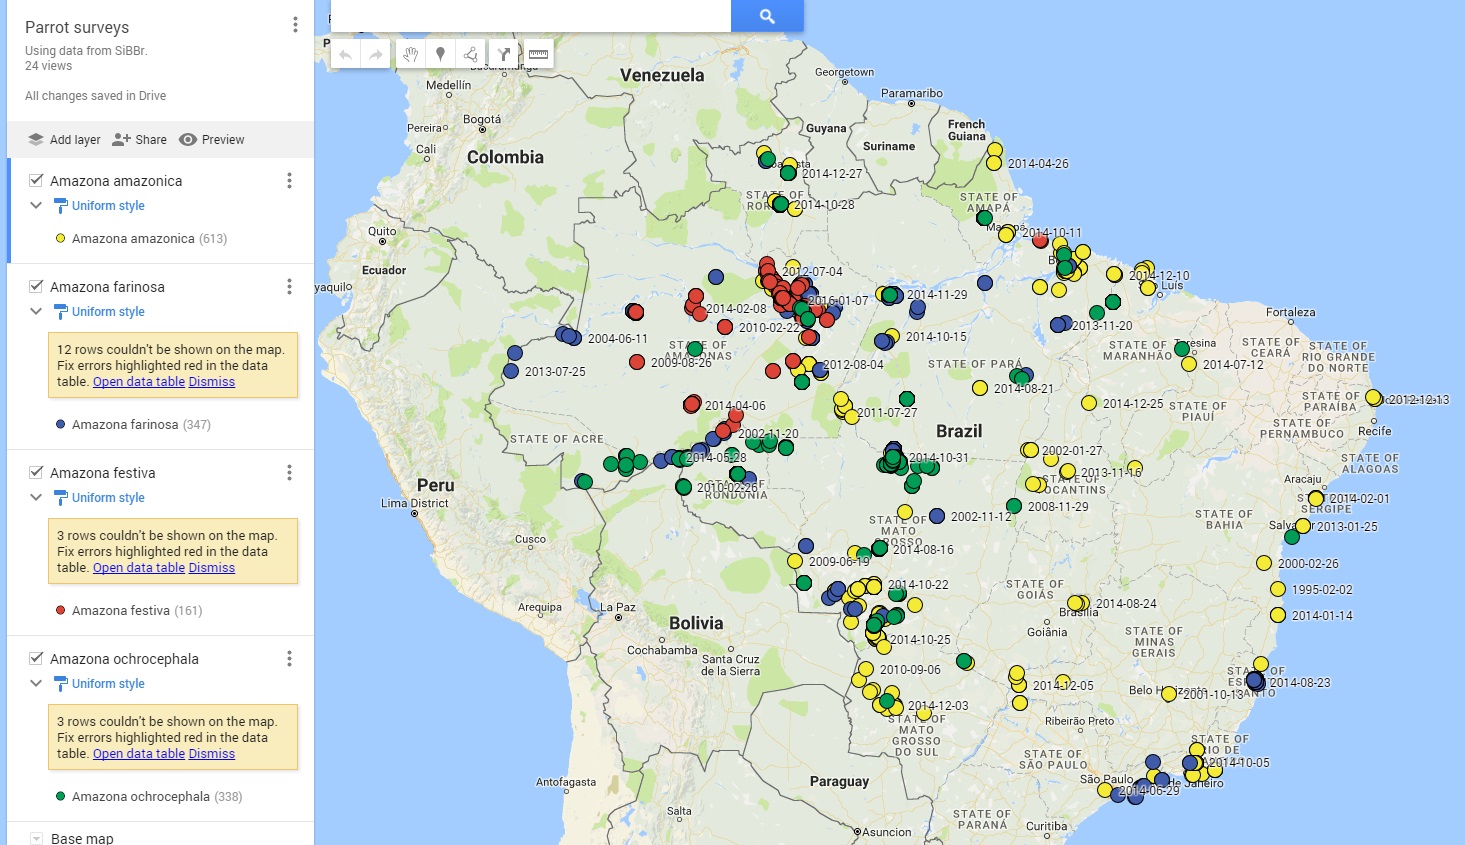
There are a lot of options for customizing the map.
This map, for example, compares distribution data for 4 species of parrots in the
genus Amazona.
Please contact Tim Vincent at PPBio for further information or comment.
PPBio Portal was developed by the management team of Data Repository PPBio/CENBAM · Copyright © 2012 · All rights reserved
2.936 André Araújo AVE - Petrópolis - Zip Code 69060-001 - Manaus-AM-Brasil
Post Box: 2223
